Deepan C Kamaraj, Brad E Dicianno, Michael Schmid, Timothy Boyanoski, Rory A Cooper
Human Engineering Research Laboratories, VA Center of Excellence on Wheelchairs and Related Technology, VA Pittsburgh Healthcare System. Department of Rehabilitation Science and Technology, School of Health and Rehabilitation Sciences, Swanson School of Engineering, University of Pittsburgh, Pittsburgh, PA.
Introduction
With the increase in the number of power wheelchair users over the last few decades, the number of wheelchair related accidents and injuries have increased (Kirby et al, 1995 and Chen WT et al, 2005). One reason for this increase is the insufficient wheelchair driving training provided for newer users leading to suboptimal driving ability (Fehr et al 2000 and Chen WT et al, 2005). Insufficient training of potential wheelchair users with limited steering and maneuvering capabilities may also hinder them from receiving a wheelchair (Massengale et al 2005), thereby reducing their level of independence. The need to develop training protocols based on an individual’s needs has, in the past, urged the development of a variety of power wheelchair driving assessment tools.
Although there are a number of tools currently available to assess power wheelchair driving skills (Dawson et al 1997, Kirby et al 2002, Massengale et al 2005, and Letts et al 2007), an objective quantification of a driver’s performance in a given task is not achievable (Miro et al, 2013). Routhier et al report such objective quantification in a controlled environment combined with the identification of specific functional impairments of a potential wheelchair user could provide crucial information necessary for planning and delivering a user specific training program (Routhier et al 2003).
With this background, this study was developed to establish a protocol to measure power wheelchair driving ability through quantitative driving metrics calculated using motion analysis. This paper discusses the process of developing this protocol along with the rationales and reasoning used in deducing the listed driving parameters that could quantify electric power wheelchair driving ability.
METHODS
-
Quantitative driving variables - Rationale & Definitions
Four one-on-one structured interviews with clinicians working in wheelchair provision clinic were conducted to understand the process of assessment during a power wheelchair driving evaluation. We aimed to delineate clinical judgment parameters that are quantifiable using variables that can be calculated using a motion analysis system in a research laboratory. Based on the interviews, the following parameters were defined:
- Assessment of safety - Both safety of the driver and safety of others around the driver were deemed important. Clinicians assess this safety parameter by the number of collisions the driver has during the assessment. Although there are no established defined numbers of collisions to classify a driver as safe or unsafe, collisions provide a good gauge of the driver’s safety. In addition, clinicians also pointed out that it was not necessarily a final collision number that gives the measure of safety, but the number of possible or impending collisions that a driver might encounter, and their ability to avoid that impending collision that gives a clinician a good insight of the driver’s safety.
- The efficiency in performing a driving task was described by a driver’s ability to control the speed and position of the chair in a pre-defined space. Clinicians recommended assessing the speed, smoothness and length of time it takes to perform tasks. Further, they recommended assessing the ability of a driver to maintain a steady progression in the direction he or she intends to be driving or are asked to drive. This, along with deviations from driving direction and the ability to volitionally make corrections, is viewed as a good measure of an individual’s driving skill.
Based on these parameters, four kinematic and time-based driving variables were proposed to quantify individuals’ driving ability. Table 1 lists these variables. These variables were calculated as follows:
Time (s): Time taken to complete the entire trial and each task was calculated separately as trial time and task time, respectively, by taking the number of reference frames to complete the trial or task and dividing by the frequency of the recording camera.
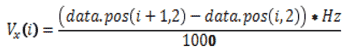
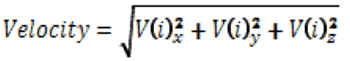
Velocity (m/s): Marker data was filtered using a second order Butterworth filter to deduce the position of a marker. Instantaneous velocity was calculated by taking the position of the wheelchair’s primary reference marker in the current frame, subtracting the wheelchair position in the previous frame, and multiplying the result by the frame rate in Hz. The resultant was expressed in mm/s, and hence, divided by 1000. The formula for instantaneous velocity of the x coordinate (Vx(i)) is shown below. A similar formula was used for y and z coordinates. Squaring the sum of the individual instantaneous velocities in the three directions, and taking the square root of the entire sum deduced the overall vector velocity of the reference marker. Average vector velocity was then calculated for each task by dividing by the number of frames.
 |
(1) |
|---|---|
 |
(2) |
Number of collisions with task boundaries: The number of times a marker on the wheelchair crosses the markers defining the dimensions of the obstacles was the number of collisions.
Root mean squared error (RMSE): RMSE was calculated for all tasks with wall or floor boundaries. Since the boundaries of the tasks were only slightly wider (36”) than the average wheelchair (26-28”), a straight line in the exact center of the path was considered the “ideal” path for each task. RMSE was defined by the equation below, where N is the number of frames, and xmidline and ymidline are the x and y coordinates of the point on the midline that is closest to the x and y position of the chair’s primary reference marker.
| (3) |
Variables |
Rationale |
Number of Collisions |
Provide a good direct assessment of the driver’s safety while using a wheelchair |
Velocity |
Ability to control the speed and position of the chair in a pre defined space |
Task completion time |
|
RMSE for the midline of each task |
The ability of a driver to maintain a steady progression in the intended driving direction, along with the deviations from this direction |
B. Experimental Setup
Driver# |
Task time (s) |
Velocity (m/s) |
RMSE |
Number of Collisions |
||||||||
1 |
2 |
3 |
1 |
2 |
3 |
1 |
2 |
3 |
1 |
2 |
3 |
|
Driving forward 30ft |
7.98 |
8.37 |
9.80 |
0.77 |
0.70 |
0.80 |
0.030 |
0.062 |
0.146 |
0 |
0 |
3 |
Making a 90 degree turn |
5.72 |
6.08 |
6.00 |
0.16 |
0.15 |
0.15 |
0.197 |
0.180 |
0.504 |
1 |
1 |
2 |
Up a 10 degree ramp |
2.42 |
2.60 |
3.50 |
0.42 |
0.38 |
0.46 |
0.090 |
0.082 |
0.046 |
0 |
0 |
0 |
Down a 10 degree ramp |
4.42 |
7.56 |
6.60 |
0.92 |
0.95 |
0.83 |
0.095 |
0.041 |
0.164 |
0 |
0 |
0 |
To capture these parameters as objective quantitative measurements, we used a passive motion analysis system comprised of twenty 3D infrared cameras, 14mm reflective markers, and the Vicon nexus 1.8 software package (Vicon motion systems, Los Angeles, CA). See Figure 1. We built a mini driving course with reflective markers attached to each obstacle within the course (see Figure 2). Similarly, thirty to thirty-five reflective markers delineated the dimensions of the chair in three-dimensional space (Figure 2). A model for the layout of the course (10ft x 72ft) is depicted in Figure 3 below. Locations of the markers were:
- Two on the foot plate
- Three on each of the 4 or 6 casters, depending on the caster type
- Two on each main drive wheel (one on each side)
- Two to define the control interface
- One on each arm rest
- Two for the attendant control (to define the rear edge of the chair)
- One on the head rest
- Six along the corners of the seat pan and backrest.
Since the power wheelchair is a rigid body moving in three-dimensional space, the markers on the chair were considered secondary markers and referenced to a set of four primary markers mounted on a custom orthogonal attachment designed to define a reference point above the power wheelchair. This custom built device with the four primary markers was attached to the power wheelchair during all trials, above the head level of the power wheelchair driver. The twenty cameras were adjusted to maximize the visibility of these primary markers. This set up minimized artifacts such as ghost markers and marker dropouts, since secondary markers if not removed could be obscured from the line of sight of the cameras.
This set up was calibrated in a three-step static process. First, the Vicon motion capture system was calibrated using a standard T-frame calibration wand ensuring camera error below 0.1mm for all cameras. Second, to define the dimensions of the PWC, a static calibration with both the primary and secondary markers was performed. These secondary markers defined the boundaries of the wheelchair in relation to the primary markers. Third, a static calibration of all the obstacles with reflective markers attached to them defined the physical dimensions of each task.
C. Data Collection Protocol
To assess the feasibility of calculating and measuring the driving variables, a mini-driving course with the following four tasks was set up:
- Driving forward 30ft in a 36" wide hallway
- Making a 90 degree turn
- Driving up a ramp with a 10 degree incline
- Driving down a ramp with a 10-degree decline.
Three able bodied researchers drove a power wheel chair (1 trial each) through the entire mini course with reflective markers as mentioned above. Data were collected at 120 Hz and processed using Vicon Nexus 1.8 software. A customized program was written in Matlab (MathWorks Inc., Natick, Massachusetts, 2010) using the three dimensional data to calculate the driving variables.
Results
Table 2 shows the driving outcome variables for each driving task.
DISCUSSION
The experimental set up and the Matlab algorithm were successful in producing the necessary quantitative information on driving ability. This protocol lays the foundation for future trials that could compare the subjective clinical judgment parameters to objectively quantified wheelchair driving metrics.
However, the study does have a few limitations. The variables calculated in our study were based on four one-on-one interviews with clinicians from one wheelchair delivery clinic. Considering the variety of tools available for driving assessment used by clinicians, additional clinical judgment parameters may need to be added. To address this issue and arrive at a consensus, we intend to conduct more interviews and focus groups at multiple centers targeted to identify other clinical parameters if any, and establish construct validity of the deduced variables. Second, we suspect calculating RMSE for a broader array of tasks could be challenging. In calculating the RMSE of a task, we adopted the center between the task boundaries as the ideal path for our tasks. However, these four tasks were stationary, in comparison to dynamic tasks such as, “ability of a powered wheelchair driver to avoid an individual walking towards them in the hallway” (Massengale et al 2005). Such dynamic tasks may not have an ideal path at the center of the hallway. During such a scenario, adopting the current approach would falsely elevate the RMSE value. Hence, for such interactive or dynamic tasks, we propose using polynomial regression to deduce the line of ideal fit, and calculating the RMSE from such a line. Assessing the RMSE in such a way along with the position of the dynamic obstacle would provide a much precise estimate of an individuals’ driving performance. Preliminary analysis using this approach has been promising.
Future direction
Establishing construct validity for the variables will be our primary focus. Following which, a larger list of tasks will be developed based on currently available assessment tools like the Wheelchair Skills Test and Power Mobility Indoor driving assessment. With the larger list of tasks and a valid set of variables, we intend to implement our protocol in a larger sample of wheelchair users during their power wheelchair driving assessment. A correlative comparison between the variables calculated in the lab, and the scores provided by multiple clinicians, at two different time points could help establish the reliability of these variables.
Applications of quantitatively measuring driving ability
A valid and reliable quantitative driving metrics could serve as a gold standard in assessing driving performance. Such standardized tools could help develop Good Clinical Practices and training protocols for new wheelchair users, and users with marginal driving skills. Pre and post training recordings of the driving metrics could help assess the strength of the training program, similar to various kinematic parameters used in gait analysis (Rathod et al 2013). With the advent of newer virtual reality based training tools (Hasadai et al 1998 and Mahajan et al 2013), we believe such quantified metrics would also help develop gaming based rehabilitation tools that could help train wheelchair drivers.
CONCLUSION
In conclusion, quantifying power wheelchair driving ability using a motion analysis system shows promise in establishing a standardized approach to power wheelchair driving assessment.
References
Chen W-Y, Jang Y, Wang J-D, Huang W-N, Chang C-C, Mao H-F, et al. Wheelchair-related accidents: relationship with wheelchair-using behavior in active community wheelchair users. Arch Phys Med Rehabil. 2011;92:892–8.
Dawson D, Chan R, Kaiserman E. Development of the Power-Mobility Indoor Driving Assessment for Residents of Long-Term Care Facilities: A Preliminary Report. Canadian Journal of Occupational Therapy. 1994;61:269–76.
Fehr L LW, Skaar S. Adequacy of power wheelchair control interfaces for persons with severe disabilities: a clinical survey. . Journal of Rehabilitation Research and Development. 2000;37(3):353 - 360.
Hasdai A, Jessel AS, Weiss PL. Use of a computer simulator for training children with disabilities in the operation of a powered wheelchair. Am J Occup Ther. Mar 1998;52(3):215-220.
Kirby RL, Ackroyd-Stolarz SA. Wheelchair safety--adverse reports to the United States Food and Drug Administration. Am J Phys Med Rehabil. 1995;74:308–12.
Kirby RL, Swuste J, Dupuis DJ, MacLeod DA, Monroe R. The Wheelchair Skills Test: a pilot study of a new outcome measure. Arch Phys Med Rehabil. 2002;83:10–8.
Letts L, Dawson D, Bretholz I, Kaiserman-Goldenstein E, Gleason J, McLellan E, et al. Reliability and validity of the power-mobility community driving assessment. Assist Technol. 2007;19:154–163; quiz 127.
Mahajan HP, Dicianno BE, Cooper RA, Ding D. Assessment of wheelchair driving performance in a virtual reality-based simulator. J Spinal Cord Med. Jul 2013;36(4):322-332.
Massengale S, Folden D, McConnell P, Stratton L, Whitehead V. Effect of visual perception, visual function, cognition, and personality on power wheelchair use in adults. Assist Technol. 2005;17:108–21
Miro JV, Black R, Andonovski B and Dissanayake G. Development of a Novel Evidence-Based Automated Powered Mobility Device Competency Assessment. 2013 IEEE International Conference on Rehabilitation Robotics June 24-26, 2013 Seattle, Washington USA
Rathod PA, Orishimo KF, Kremenic IJ, Deshmukh JA, Rodriguez JA. Similar Improvement in Gait Parameters Following Direct Anterior & Posterior Approach Total Hip Arthroplasty, The Journal of Arthroplasty, Available online 2 December 2013, ISSN 0883-5403, http://dx.doi.org/10.1016/j.arth.2013.11.021. (http://www.sciencedirect.com/science/article/pii/S0883540313008668)
Routhier F VC, Desrosiers J, Nadeau S. Mobility of wheelchair users: a proposed performance assessment framework. . Disability and Rehabilitation. 2003;25:19Audio Version PDF Version